TensorBoard Guide: Essential Tool for Model Training and Evaluation
Learn how TensorBoard transforms deep learning workflows with powerful visualization tools, enabling comprehensive model analysis, performance tracking, and insight-driven optimization.

TensorBoard is a powerful tool designed to enhance and streamline the model training and testing processes, providing an intuitive, visual interface that supports efficient model evaluation. Integrated seamlessly within Google Colab, TensorBoard enables users to visualize metrics and track performance directly within the notebook environment, offering real-time insights that are essential for optimizing machine learning workflows. We will be using my previous post as an example.
To begin, initialize the TensorBoard extension within your environment.
# Load the TensorBoard notebook extension
%load_ext tensorboard
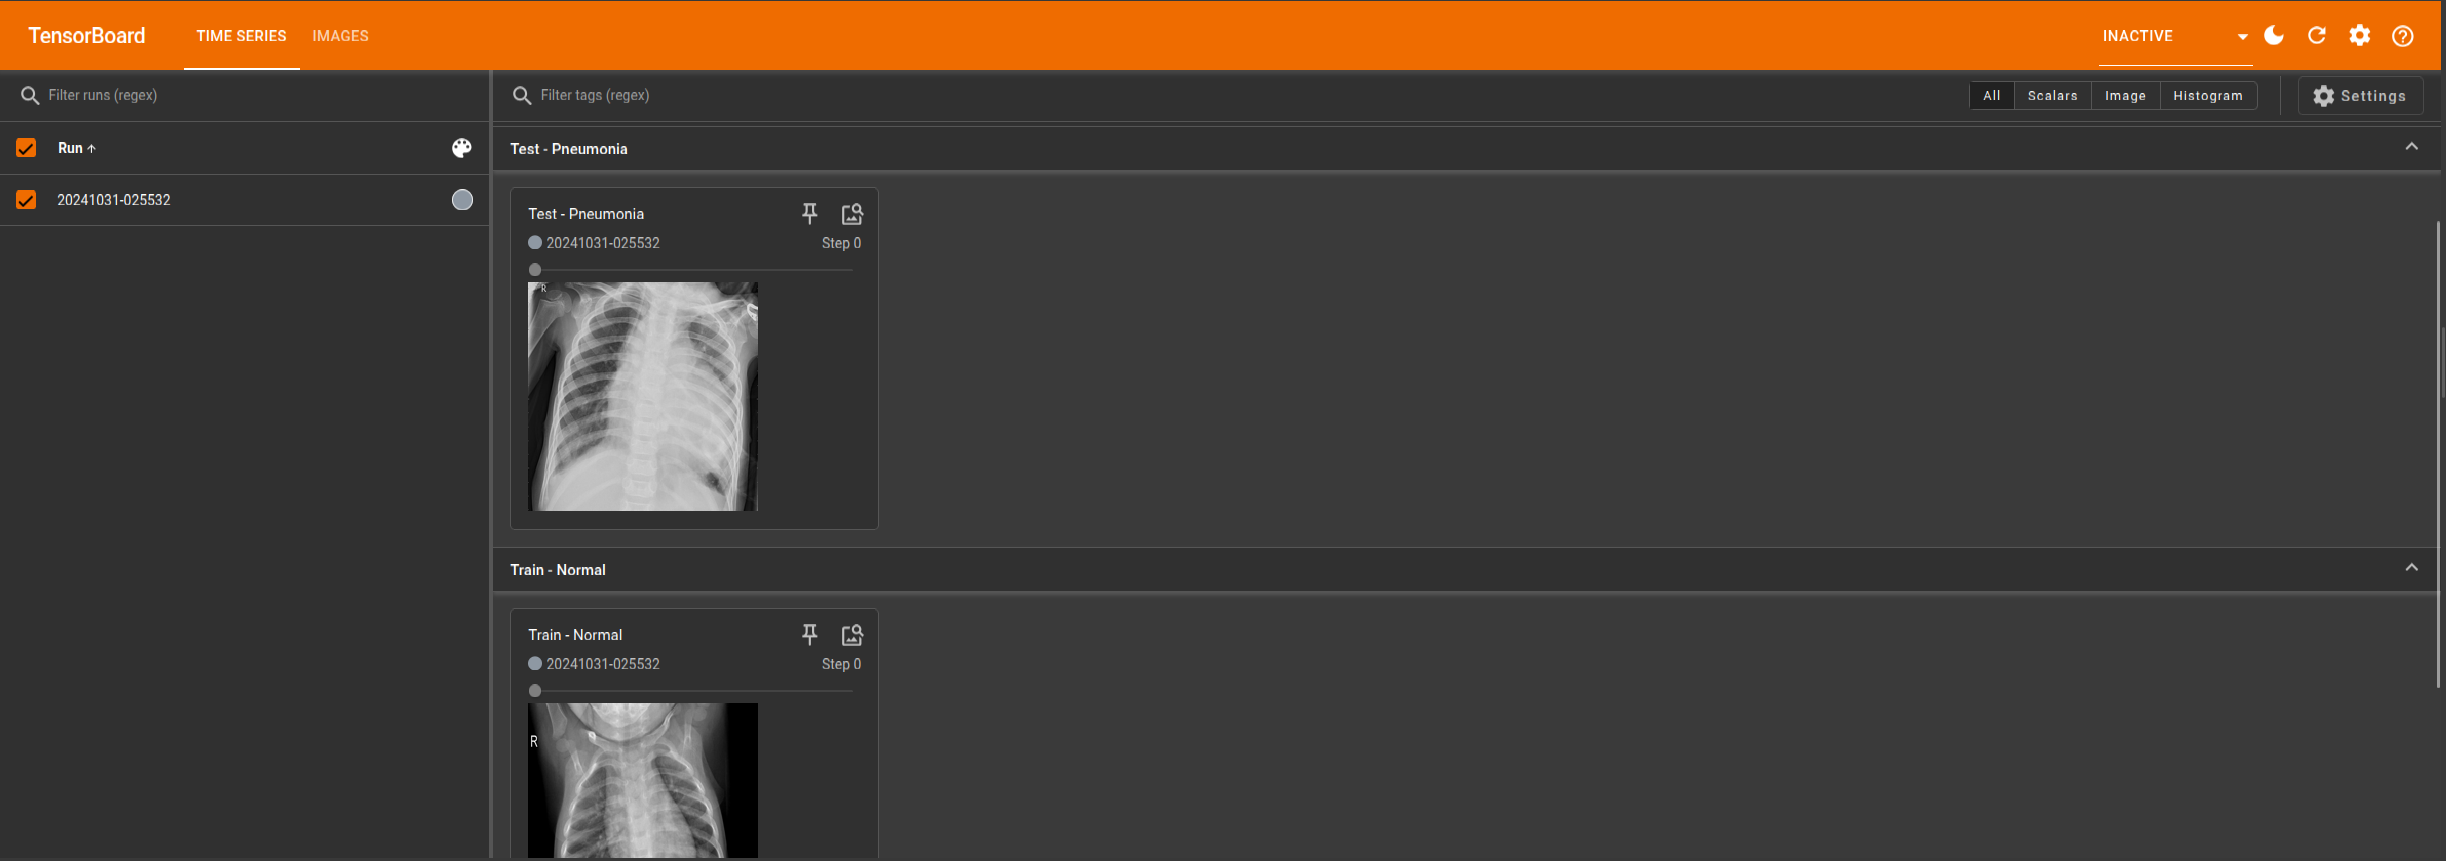
TensorBoard can be used to visualize images directly from various directories, providing a structured view of image data for different classes. By setting up a dedicated log directory, TensorBoard enables users to monitor images across classes, which facilitates more effective model training by allowing direct inspection of the input data. Images are resized and normalized before being logged, ensuring uniformity for display within TensorBoard’s interface. This setup is particularly useful for verifying input quality, ensuring class distinctions are maintained, and enhancing interpretability during model training or testing phases.

Training Logs
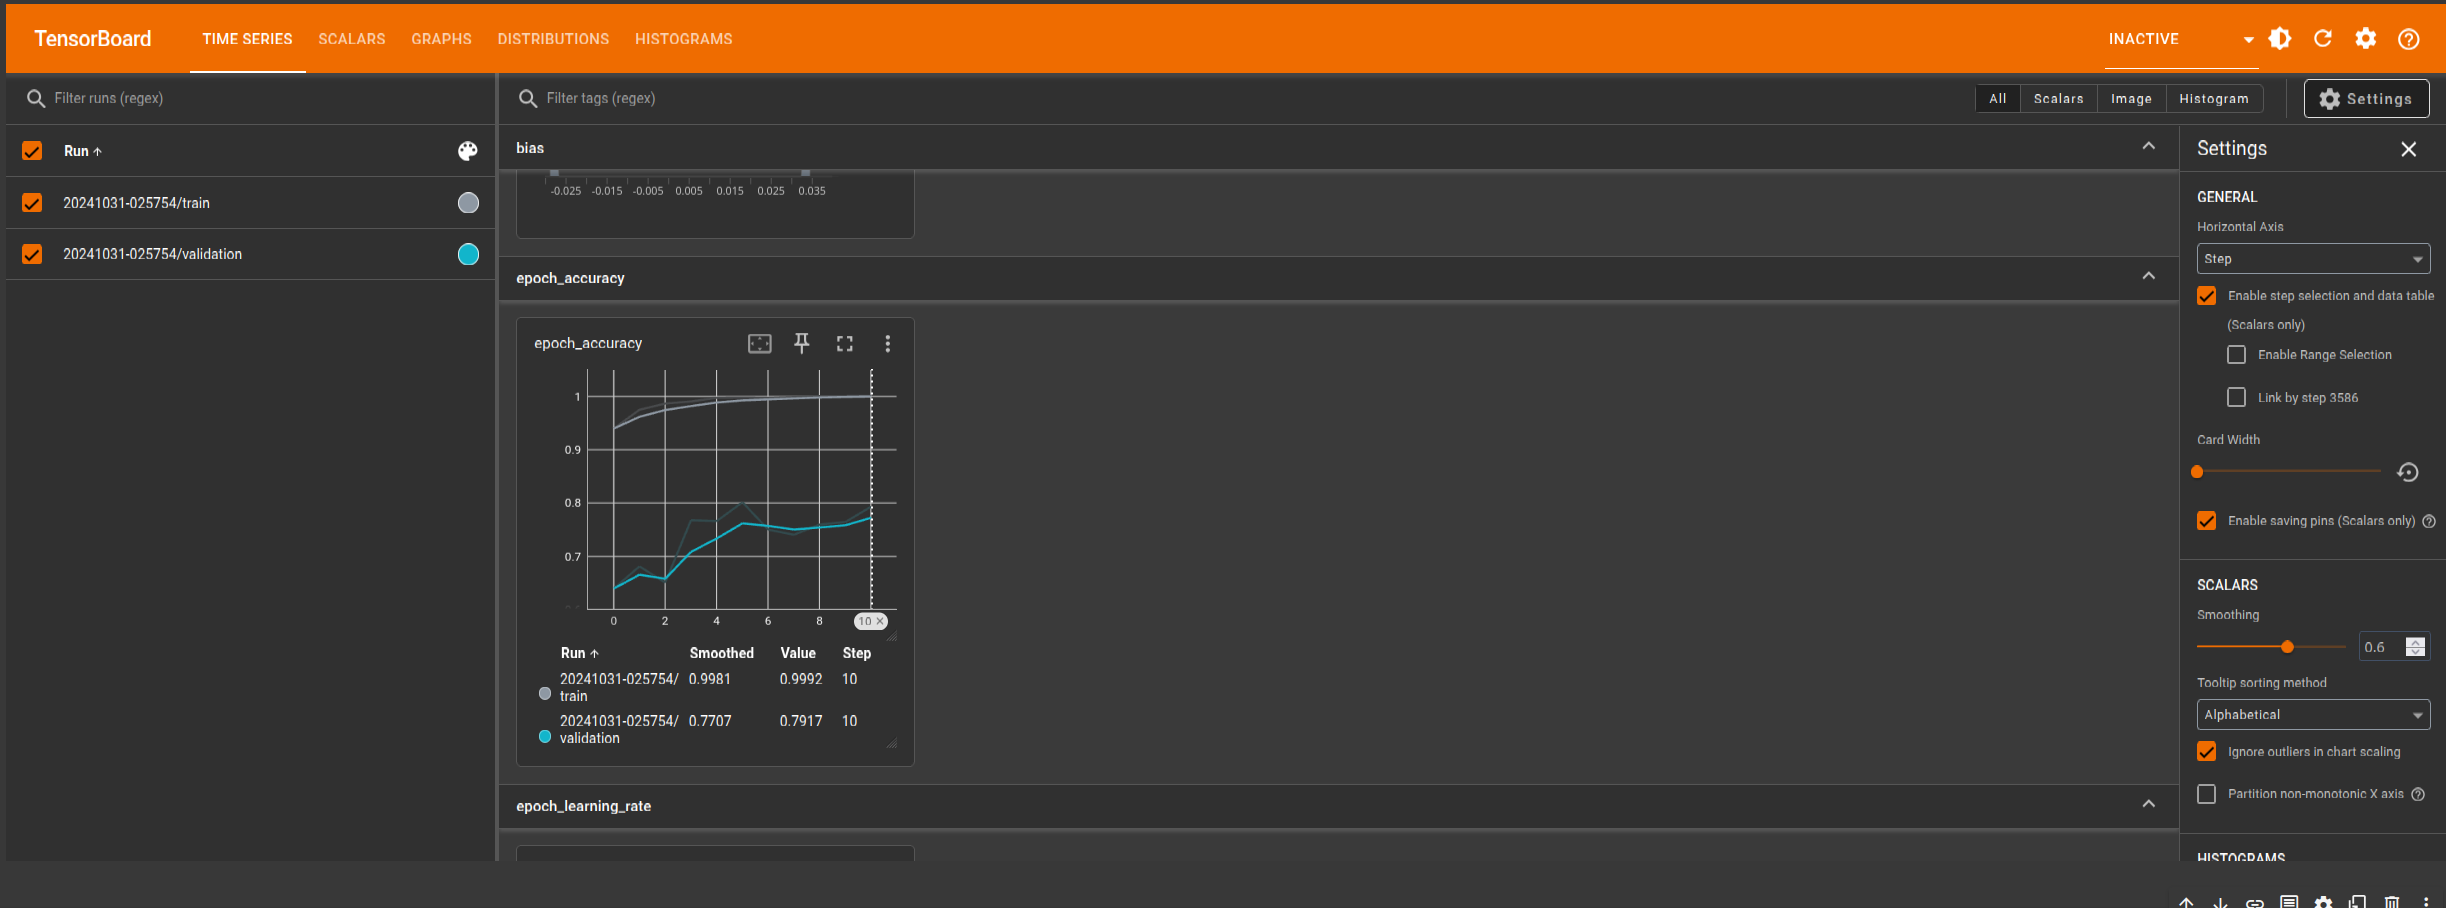
Below is an example where TensorBoard's logging capabilities are utilized through a designated log_dir and a callback function, which records relevant metrics after each training epoch. The log_dir specifies the storage location for all logs, allowing TensorBoard to track and display progress in real time. By incorporating the callback, TensorBoard captures updates on training metrics systematically, providing insights into performance trends and helping optimize model adjustments with each epoch.
log_dir = "logs/fit/" + datetime.datetime.now().strftime("%Y%m%d-%H%M%S")
tensorboard_callback = tf.keras.callbacks.TensorBoard(log_dir=log_dir, histogram_freq=1)

# Train the model
history = model.fit(
    train_generator,
    # steps_per_epoch=steps_per_epoch,
    epochs=40,
    validation_data=test_generator,
    # validation_steps=validation_steps,
    callbacks=[checkpoint, early_stopping, reduce_lr, tensorboard_callback]
)
Tracking the learning process with a callback
To visualize the logs, access TensorBoard's user interface, which provides an interactive display of model metrics. This UI offers a comprehensive view of training progress, enabling users to analyze trends, compare performance across metrics, and identify areas for improvement. Launching TensorBoard’s UI allows for an in-depth examination of logged data, contributing to a more informed and efficient model development process.
%tensorboard --logdir logs/fit
Metric Logs
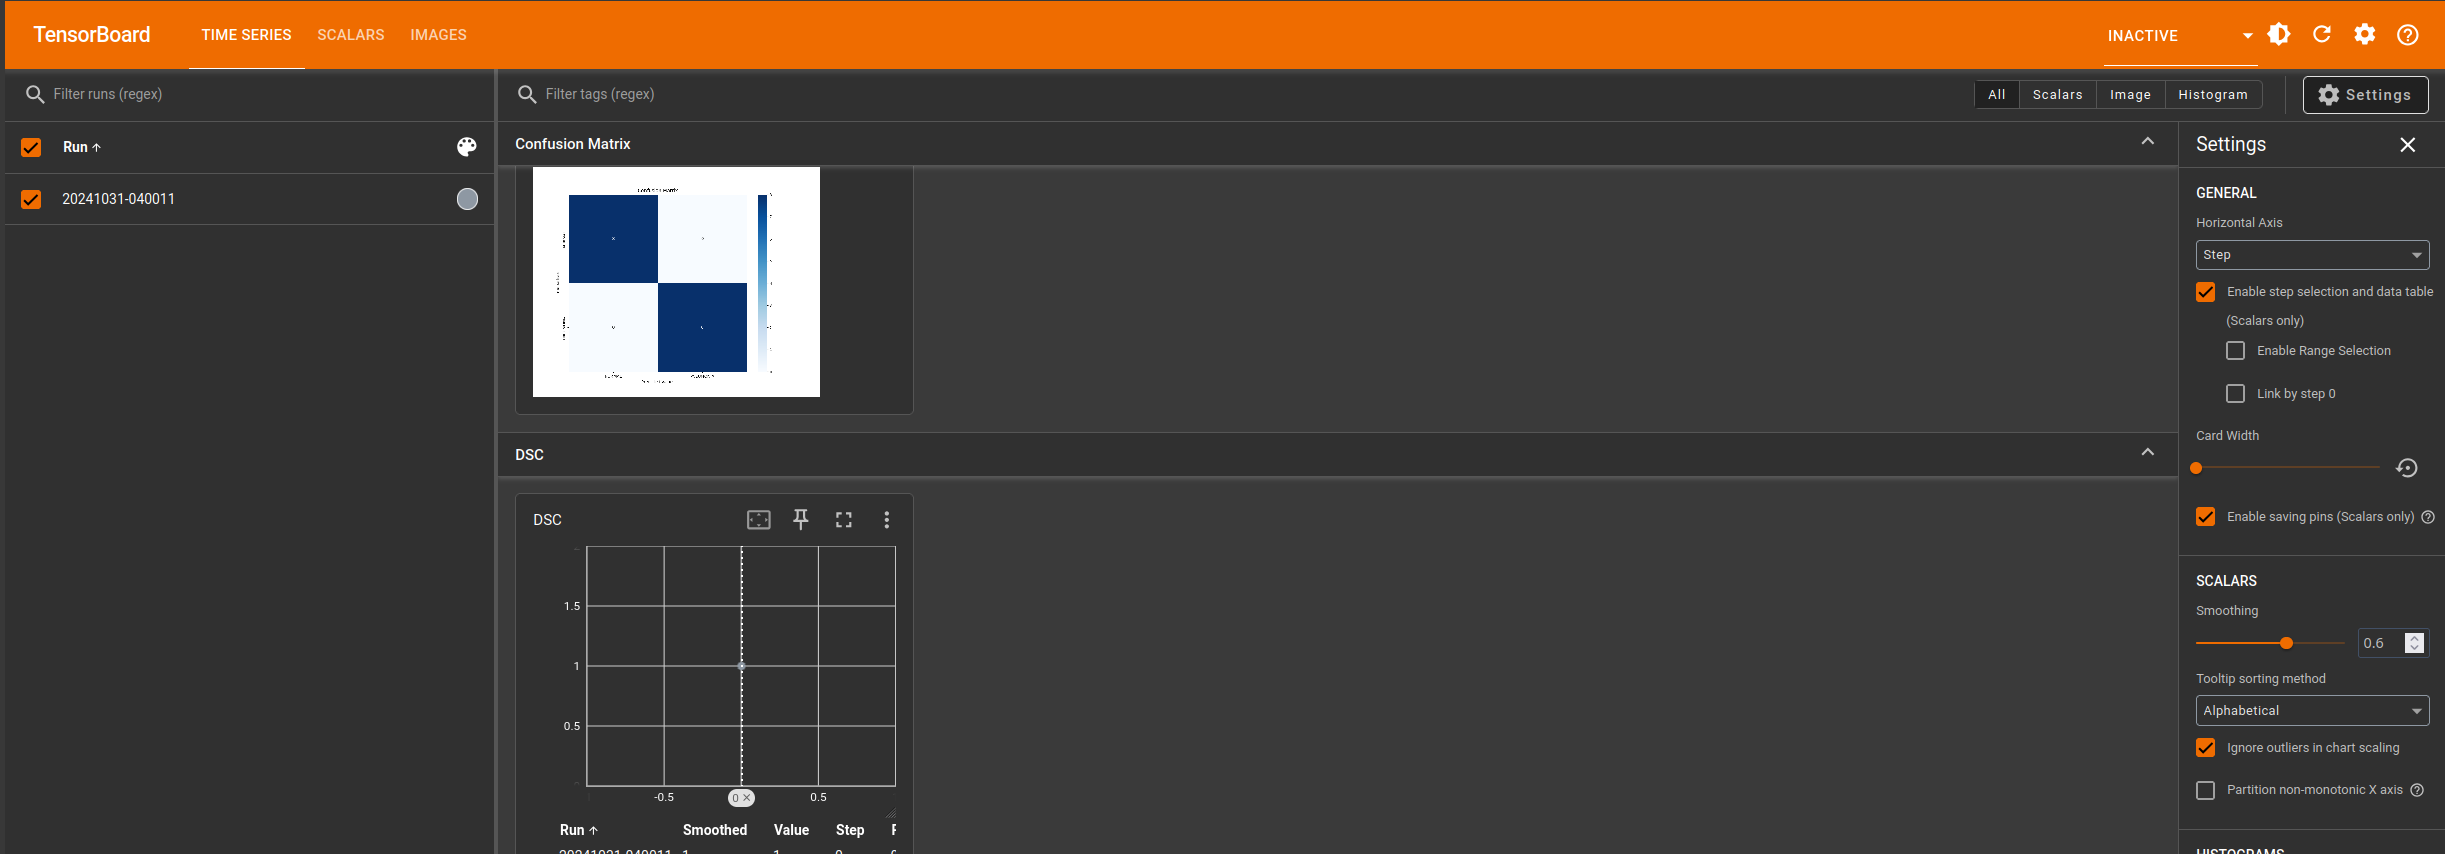
This example leverages TensorBoard to monitor classification performance by logging evaluation metrics, including a confusion matrix, normalized confusion matrix, and key performance metrics such as DSC (Dice Similarity Coefficient), sensitivity, specificity, and accuracy. TensorBoard’s integration allows for real-time visualization of these metrics, providing valuable insights into the model's performance on a per-class basis. By visualizing confusion matrices, TensorBoard enables users to assess prediction distributions across classes, highlighting any areas where model improvements may be needed. This systematic logging approach facilitates deeper understanding and optimization of classification tasks over time.
import tensorflow as tf
import seaborn as sns
import numpy as np
from sklearn.metrics import confusion_matrix, accuracy_score
import matplotlib.pyplot as plt
import io
import datetime

# Define the classes for the confusion matrix
classes = ['NORMAL', 'PNEUMONIA']

# Function to convert a Matplotlib figure to a TensorBoard-compatible image
def plot_to_image(figure):
    buf = io.BytesIO()
    figure.savefig(buf, format='png')
    plt.close(figure)
    buf.seek(0)
    image = tf.image.decode_png(buf.getvalue(), channels=4)
    return tf.expand_dims(image, 0)

# Function to calculate and log metrics to TensorBoard
def calculate_metrics(y_true, y_pred, logdir, step=0):
    # Confusion matrix
    cm = confusion_matrix(y_true, y_pred)

    # Plot Confusion Matrix and log it
    fig = plt.figure(figsize=(10, 8))
    sns.heatmap(cm, annot=True, fmt='g', cmap='Blues', xticklabels=classes, yticklabels=classes)
    plt.xlabel('Predicted Values')
    plt.ylabel('True Values')
    plt.title('Confusion Matrix')
    cm_image = plot_to_image(fig)

    # Normalized confusion matrix
    cm_normalized = cm.astype('float') / cm.sum(axis=1)[:, np.newaxis]

    # Plot normalized Confusion Matrix and log it
    fig_norm = plt.figure(figsize=(10, 8))
    sns.heatmap(cm_normalized, annot=True, fmt='.2f', cmap='Blues', xticklabels=classes, yticklabels=classes)
    plt.xlabel('Predicted Values')
    plt.ylabel('True Values')
    plt.title('Normalized Confusion Matrix')
    cm_norm_image = plot_to_image(fig_norm)

    # Calculate metrics for each class and average them
    dsc = np.mean([2.0 * cm[i, i] / (np.sum(cm[i, :]) + np.sum(cm[:, i])) for i in range(cm.shape[0])])
    sensitivity = np.mean([cm[i, i] / np.sum(cm[i, :]) for i in range(cm.shape[0])])
    specificity = np.mean([np.sum(np.delete(np.delete(cm, j, 0), j, 1)) / np.sum(np.delete(cm, j, 0)) for j in range(cm.shape[0])])
    accuracy = accuracy_score(y_true, y_pred)

    # Set up TensorBoard writer and log metrics and images
    file_writer = tf.summary.create_file_writer(logdir)
    with file_writer.as_default():
        # Log scalar metrics
        tf.summary.scalar('DSC', dsc, step=step)
        tf.summary.scalar('Sensitivity', sensitivity, step=step)
        tf.summary.scalar('Specificity', specificity, step=step)
        tf.summary.scalar('Accuracy', accuracy, step=step)

        # Log confusion matrices as images
        tf.summary.image("Confusion Matrix", cm_image, step=step)
        tf.summary.image("Normalized Confusion Matrix", cm_norm_image, step=step)

    return dsc, sensitivity, specificity, accuracy

logdir = "logs/metrics/" + datetime.datetime.now().strftime("%Y%m%d-%H%M%S")
predictions_prob = model.predict(validation_generator)
predictions = np.argmax(predictions_prob, axis=1)

# Calculate and log metrics
dsc, sensitivity, specificity, accuracy = calculate_metrics(validation_generator.classes, predictions, logdir)
print(f"DSC: {dsc}, Sensitivity: {sensitivity}, Specificity: {specificity}, Accuracy: {accuracy}")

TensorBoard stands as a vital companion in the deep learning workflow, offering a rich, interactive platform for tracking, analyzing, and improving model performance. Its visualization capabilities provide an accessible means of interpreting complex metrics, from loss curves to intricate confusion matrices, making it invaluable for both novice and expert practitioners. By incorporating TensorBoard effectively, users can streamline experimentation, identify areas for model refinement, and ensure that each phase of training and evaluation is both measured and optimized. As machine learning models continue to grow in complexity, TensorBoard remains a key tool for clarity, efficiency, and enhanced model interpretability.
References


Comments ()